Change Log

March 2024

Enhanced Charts & Index Page

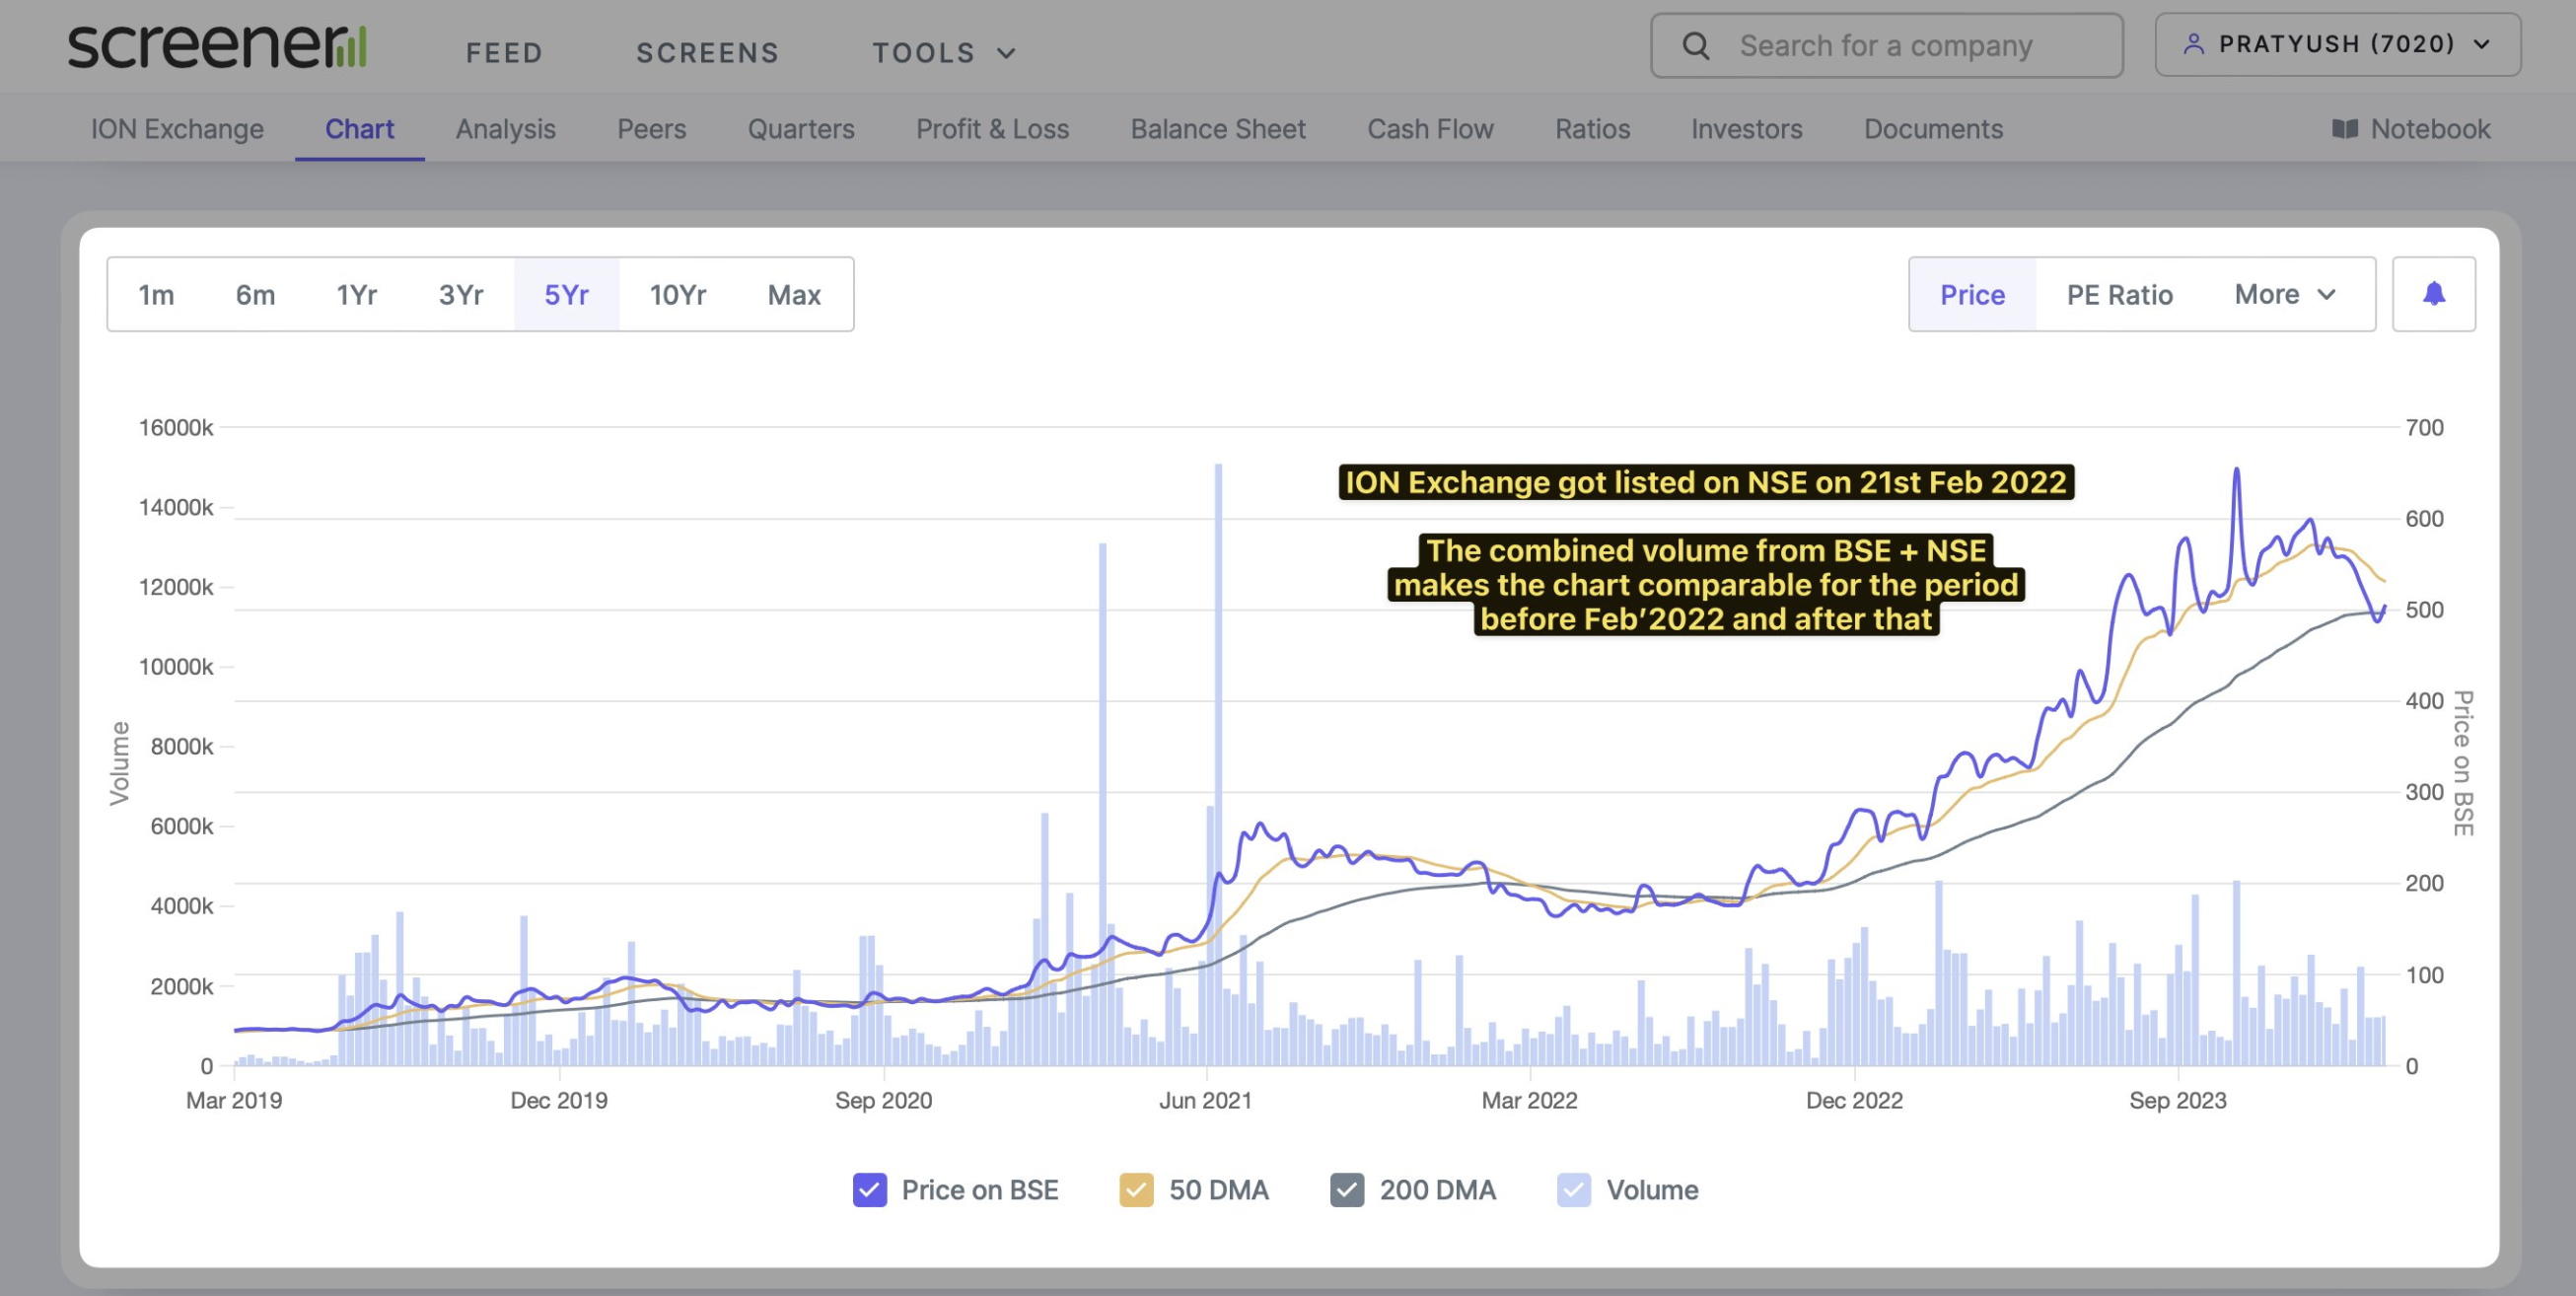
A) We have added a small optimization in the charts. The volume bars now show the combined volume from BSE + NSE. This gives the right chart for companies that were earlier listed only on one exchange.
Chart of Ion Exchange

B) We have added the Moving averages data to the Index Page and Now, the Index constituents can also be downloaded to Excel allowing for more in-depth analysis. 

February 2024

Debtors Bifurcation on the Balance sheet

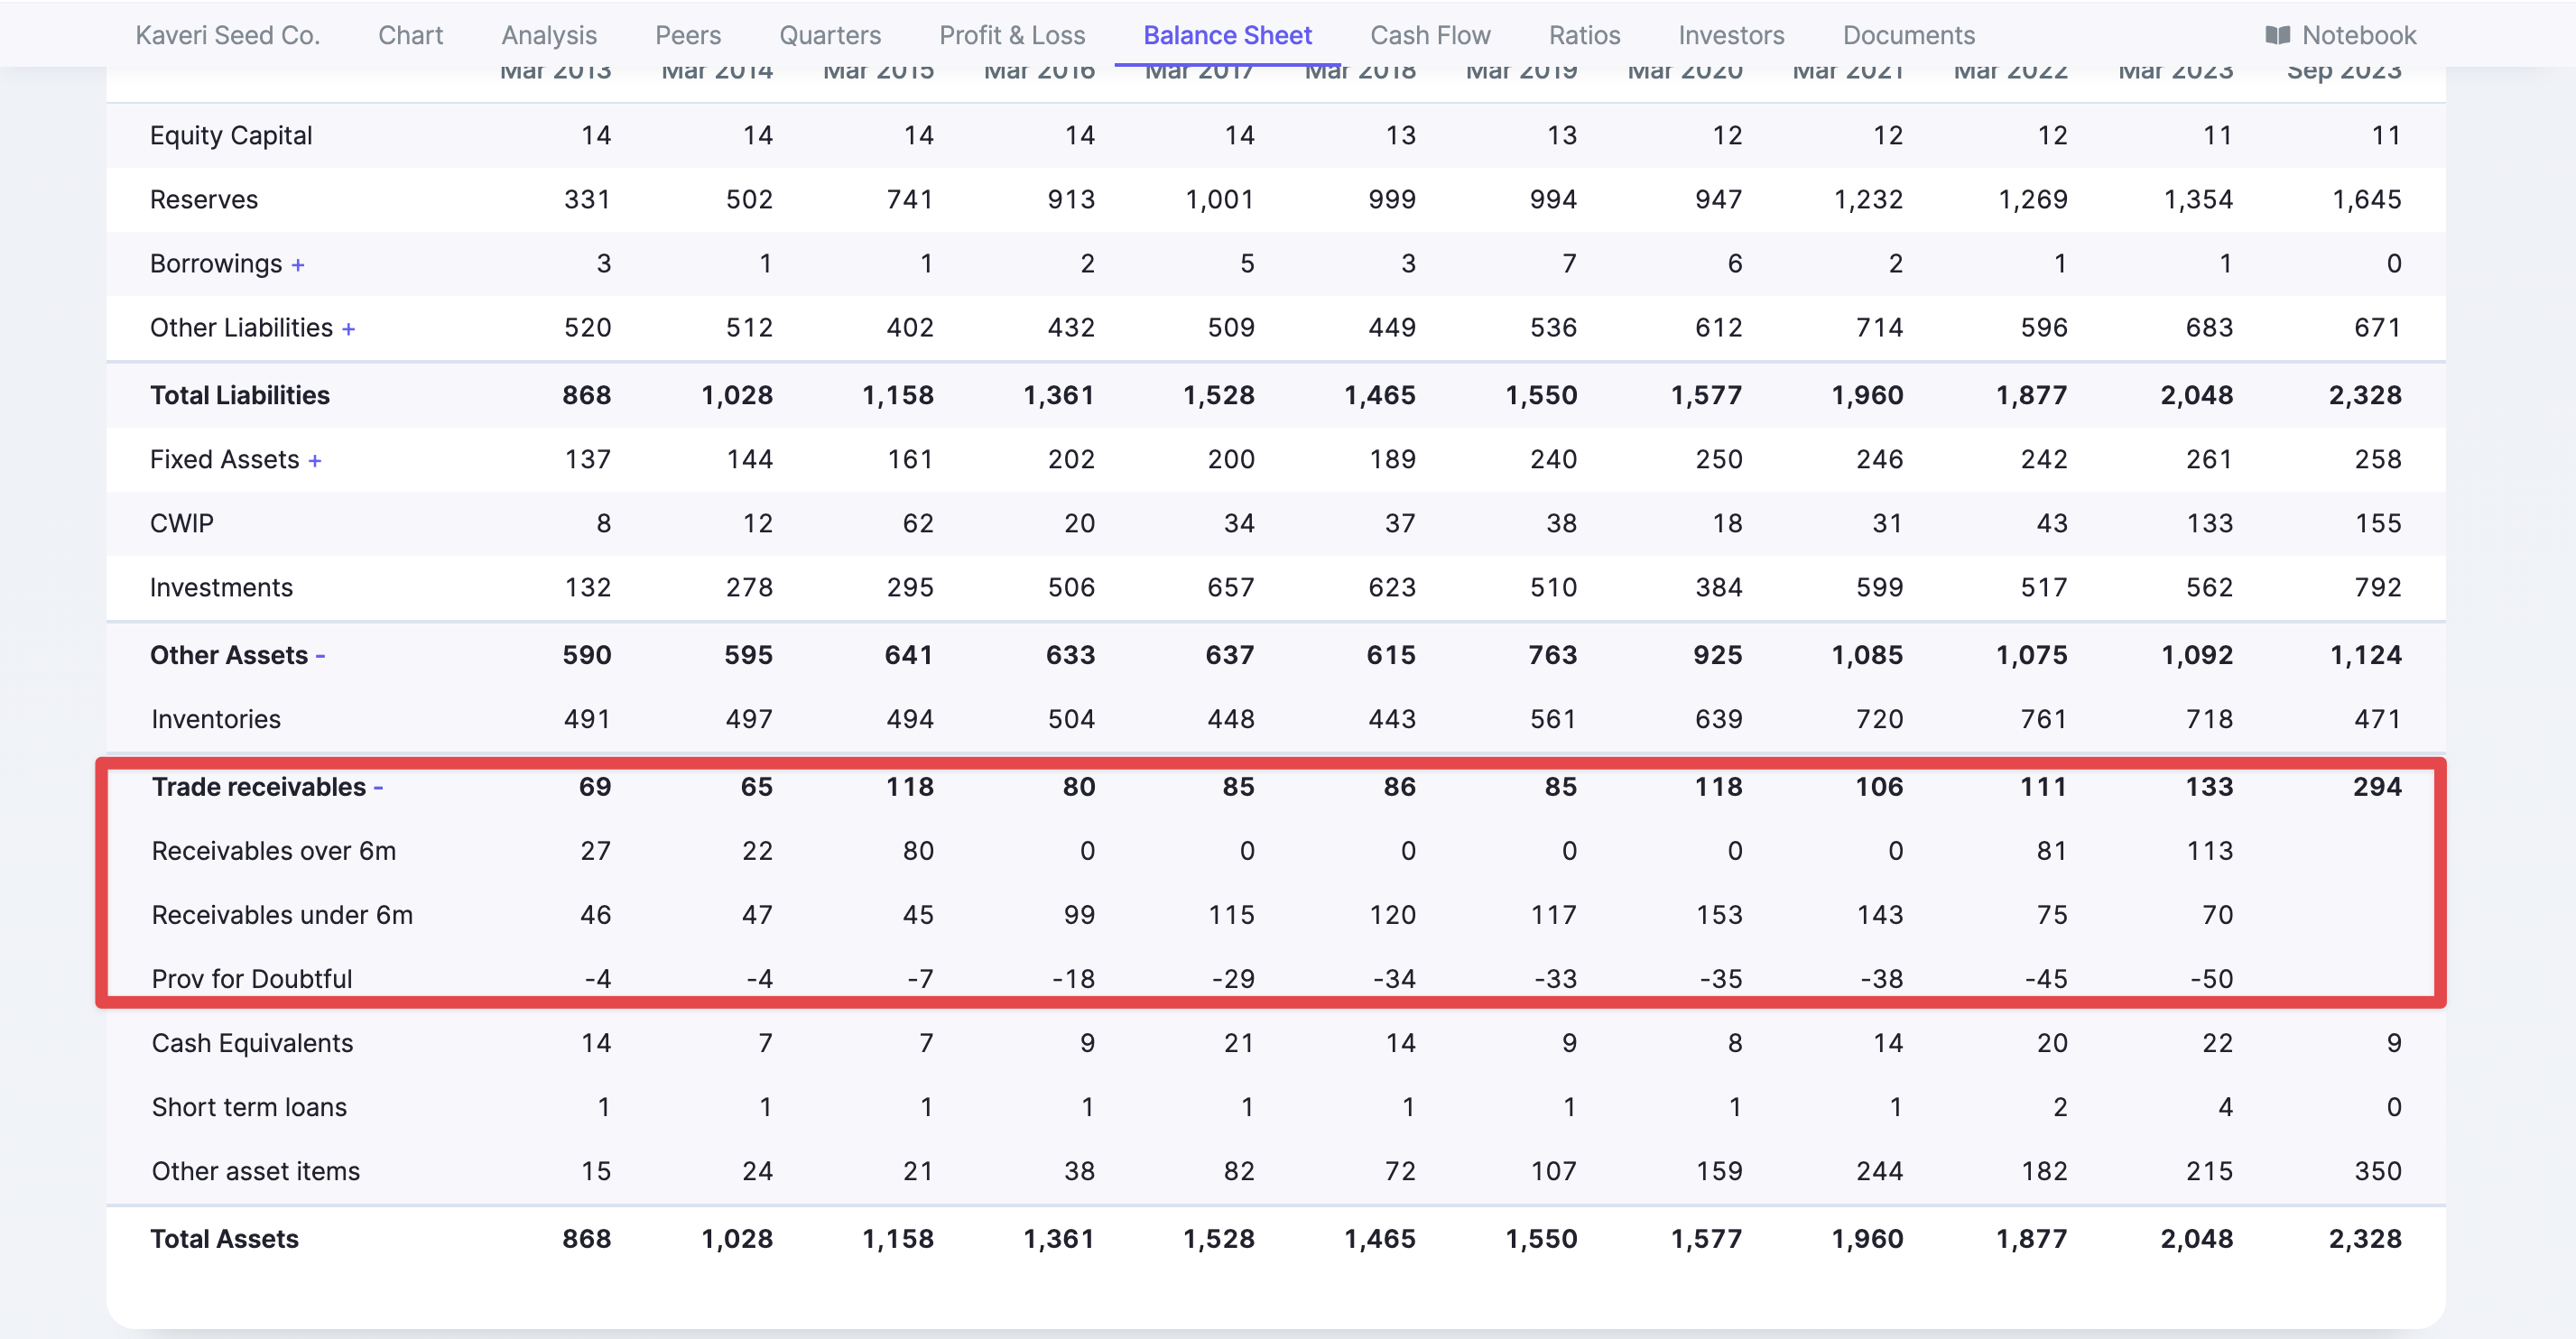
Now, we show these line items by making "Trade Receivables" clickable on the balance sheet.
- Receivables over 6months
- Receivables under 6months
- Provision for doubtful debts
- Trade receivables
Debtors Bifurcation
Note: The trade receivables will be clickable only when the receivables over 6 months are more than 5% of trade receivables.

January 2024

A quick Tutorial on How to use Screener.in

We have made a few videos that will help you effectively utilize the features on the website. These videos will help you understand how to read Financial statements, create screen & price alerts, build your custom screen, and other insights into the hidden features of screener.in

You can watch the Videos here: https://www.upsurge.club/course/learn-how-to-use-stock-screener?invite=SCRNR-IN


December 2023

Track Upcoming Concalls

On the Latest Filings page, we have added a new section for Upcoming Concalls.
https://www.screener.in/concalls/upcoming/
Now, our users can track the Date and Time of the Upcoming Concalls on the above page.

Added Index Data

We have added separate pages for Indices like Nifty 50, Sensex, Nifty Bank, Nifty Auto and others.
https://www.screener.in/company/NIFTY/

On the index page, we show:

a) Index value -  PE, PBV, Div Yield, and others
b) Charts - Price, PE, Dividend Yield, and Price to Book value
c) Constituents - Here, we provide the list of stocks part of the Index.

October 2023

Track Upcoming Corporate Actions.

The Latest Filings page has three sections:
1) Documents
2) Trades
3) Corporate Actions

In the Corporate Actions Table, we have added pages for:
1) Bonus
2) Splits
3) Right Issues
4) Buy Backs
5) Dividends
Track Corporate Actions


September 2023

Captured No. of Shareholders Data

There is an interesting correlation between the No. of Shareholders and the Stock returns as shown in the below Screenshot.
TCS Chart
Now, we have added a separate column for the No. of Shareholders in the Shareholding Pattern Table.
No. of shareholders column

August 2023

Change in Calculation Methodolgy

1) Historical ROCE Calculation
We have historical ROCE ratios like Average return on capital employed 3,5,7,10 Years. Earlier, we calculated it based on the weighted average. Now, the ratios show the median value.

2) Median PE Algorithm
Earlier, the Historical PE 3,5,7,10 years ratio showed the year-end values. Now it is calculated by taking the average values across all the traded days for the said period.

1 2 3 4 11 12 Next