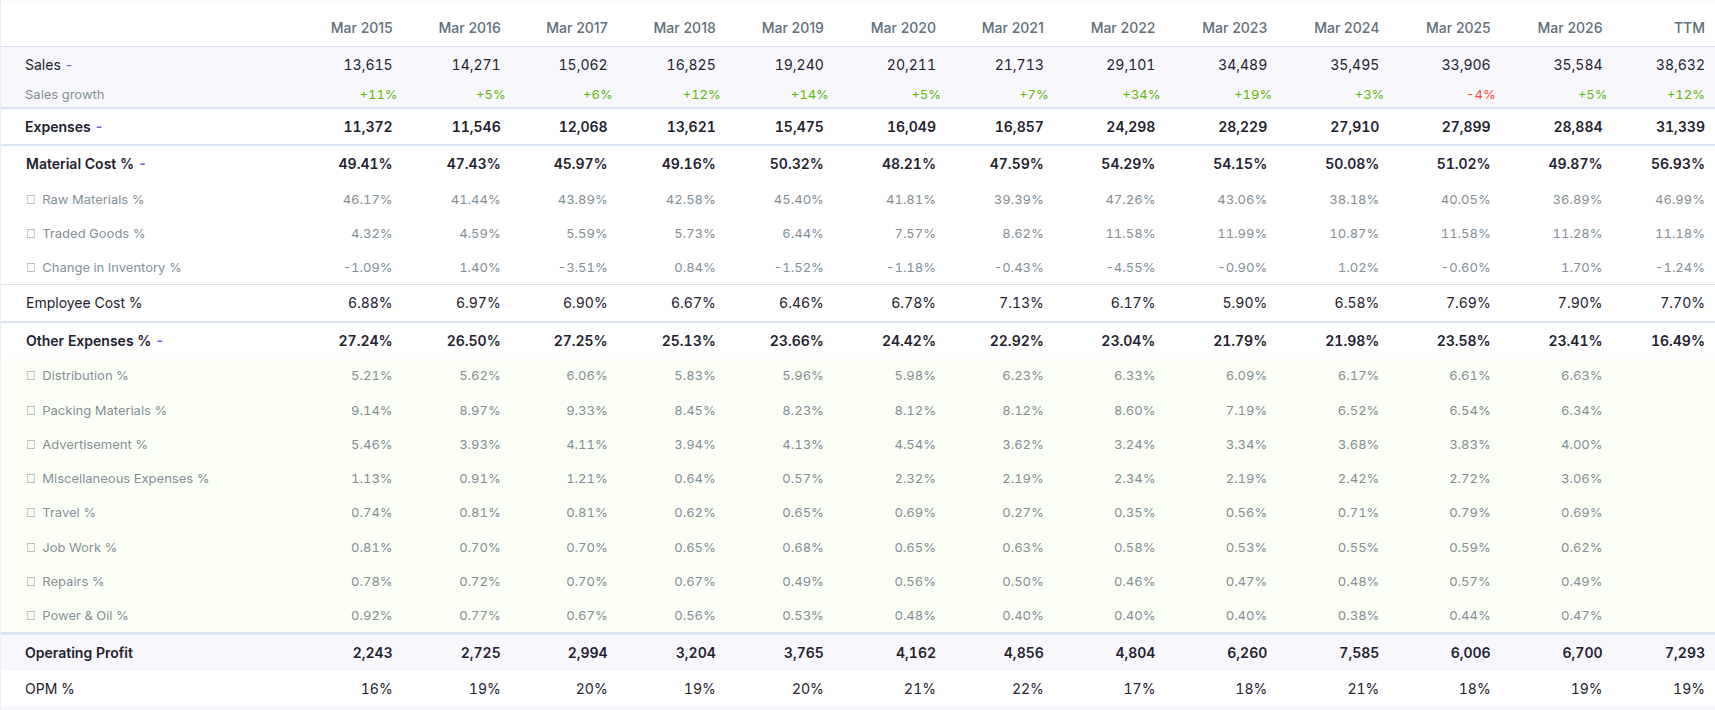
Open Asian Paints → Profit & Loss. Expand Sales to see Sales growth beside each year, then Expenses to compare Material Cost %, Employee Cost % and Other Expenses % as shares of sales.
Expand Material Cost % further for Raw Materials %, Traded Goods % and Change in Inventory %. Sign in to expand Other Expenses % into its biggest reported costs, such as Advertisement % and Distribution %.
For example, Asian Paints' consolidated Material Cost % fell from 51.02% in March 2025 to 49.87% in March 2026, while Employee Cost % rose from 7.69% to 7.90%. Use the breakdown to investigate what changed—not just whether the operating margin improved.