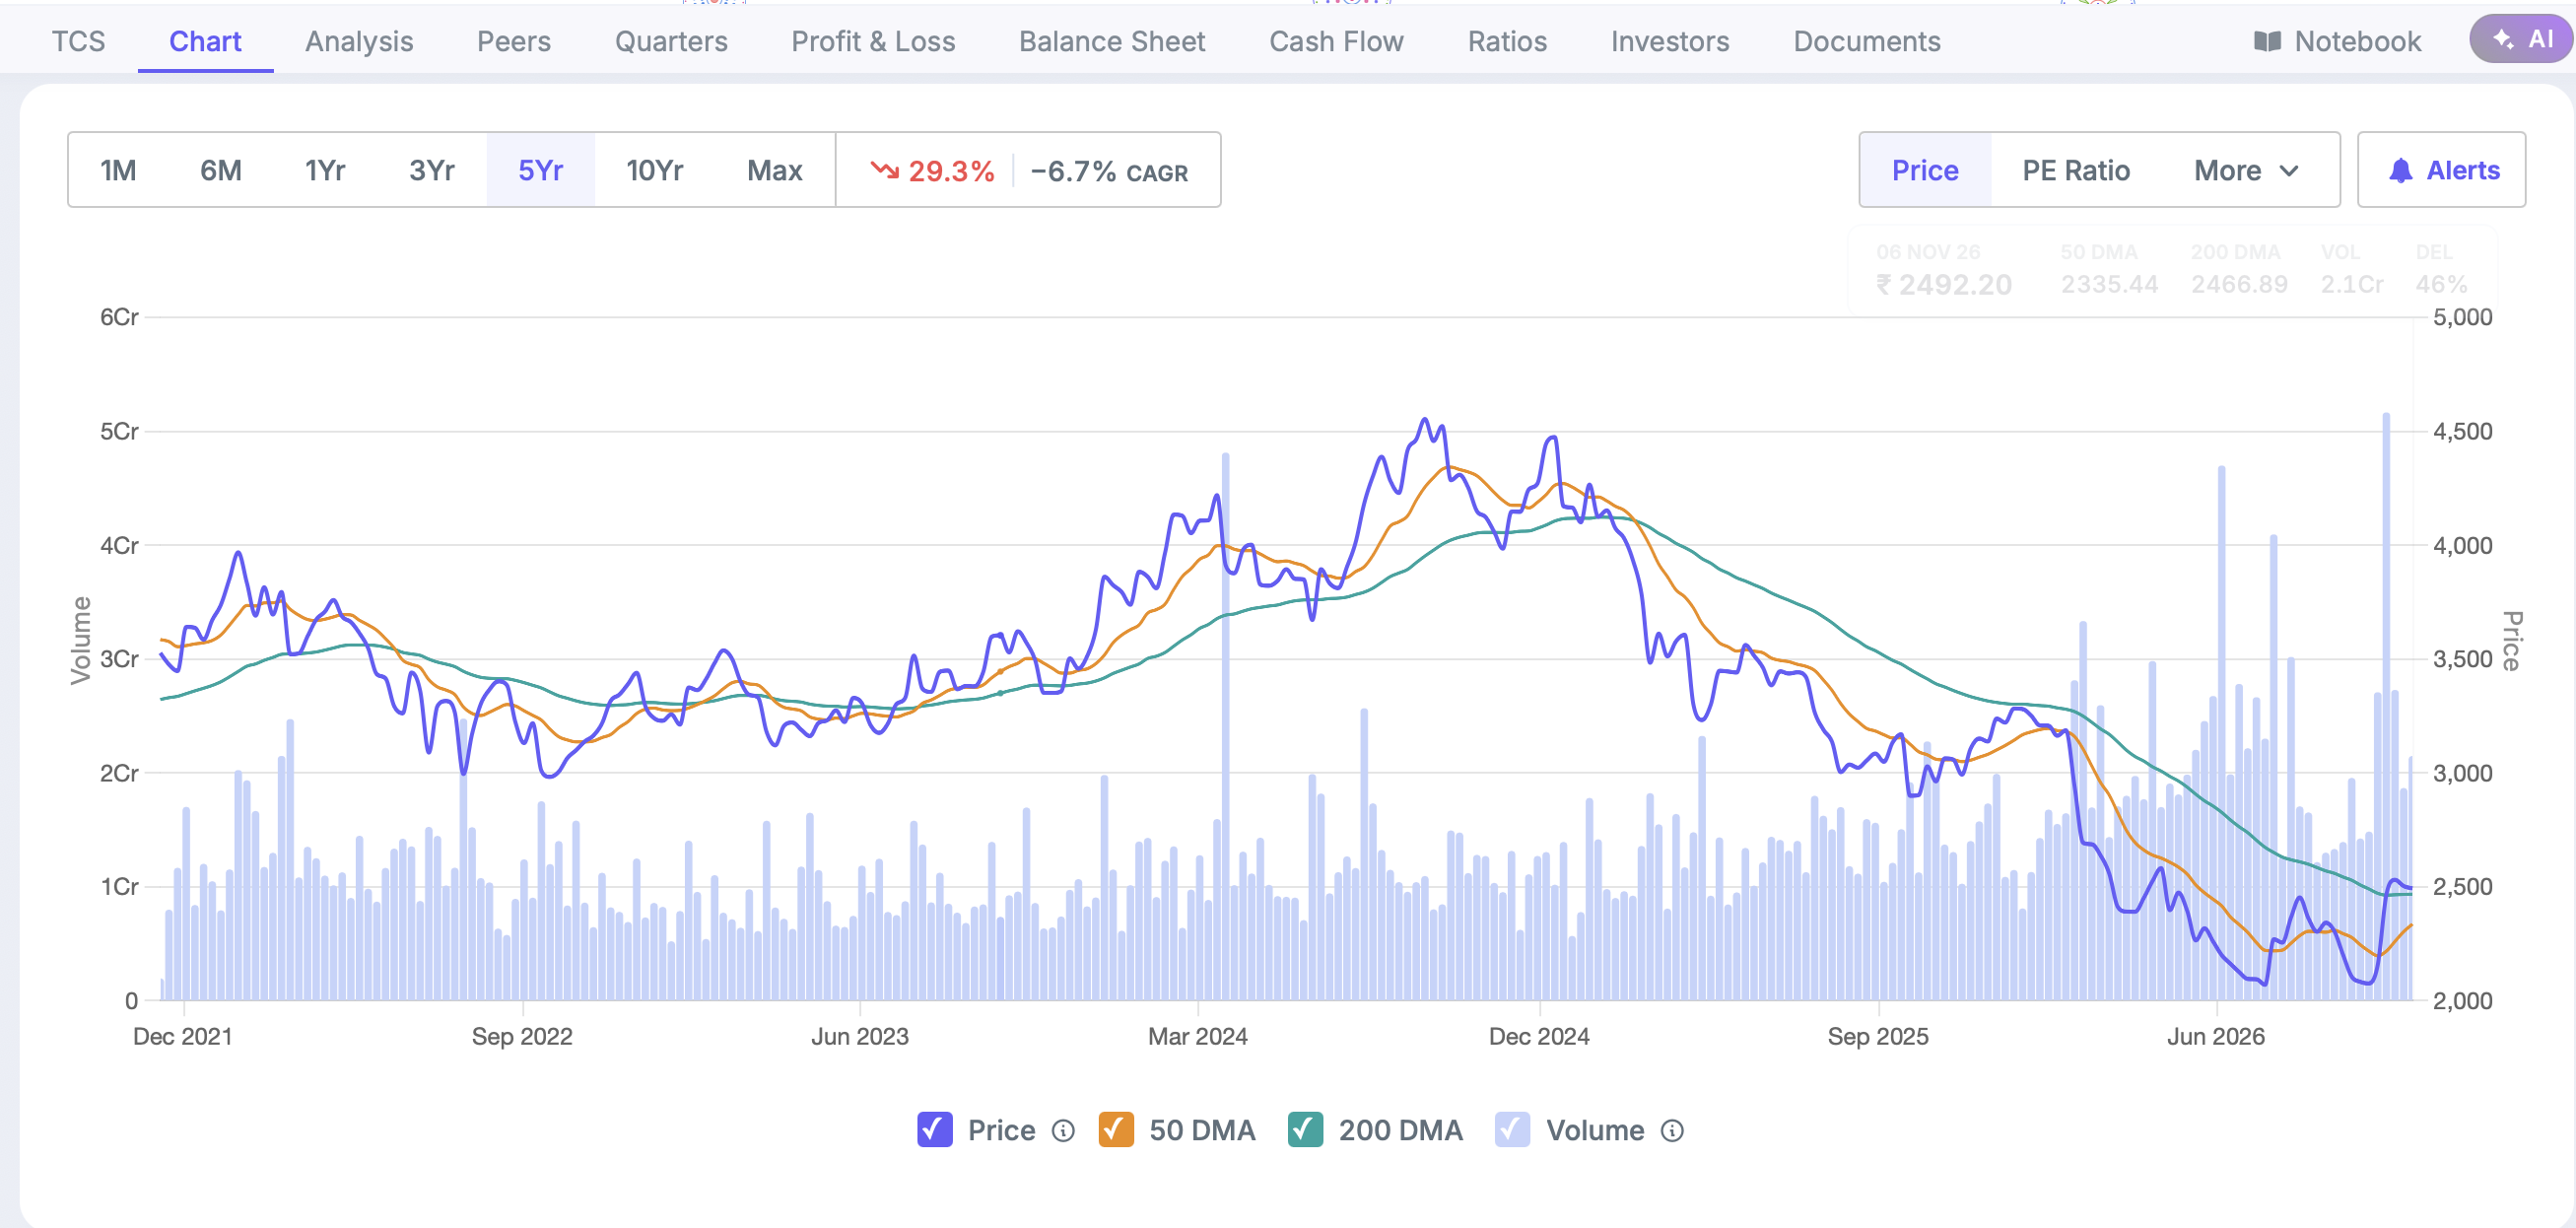
Open TCS → Chart → 5Yr on desktop. Hover over a past date to see “From here”: the price change from that date to the latest plotted price. Drag across two dates to compare a specific period, with CAGR for ranges of a year or more.
For example, TCS's chart shows an 11.0% price gain (4.5% CAGR) from 21 October 2022 to 28 February 2025. Try different starting dates to see how the research period changes the result.
TCS: Hover over a past date to see the price change from there.